Linearity of the Vi-CELL BLU Cell Counter and Analyzer
Introduction
The Vi-CELL BLU Cell Counter and Analyzer enables automated cell counting and cell viability analysis. Samples can be loaded using a 24-position sample carousel or a 96-well plate, and in Fast Wash mode the system requires as little as 170 μL sample volume to determine cell count, concentration and viability. The system fully automates sample preparation, analysis and post-run cleaning, which makes it easy-to-use, while still delivering results users can trust. In this application note, we demonstrate the system’s linearity across the whole concentration range from 50,000 to 15,000,000 cells/mL. To that end, the device’s performance was tested using calibration control beads. Afterward, a dilution series of cultured CHO cells was prepared to verify the system with live cells.
Concentration control beads
First, several control standards (Table 1) were measured with the Vi-CELL BLU analyzer as described in the respective manuals. For analysis, the cell type BCI Conc Beads was selected, with dilution 1 and Normal wash.
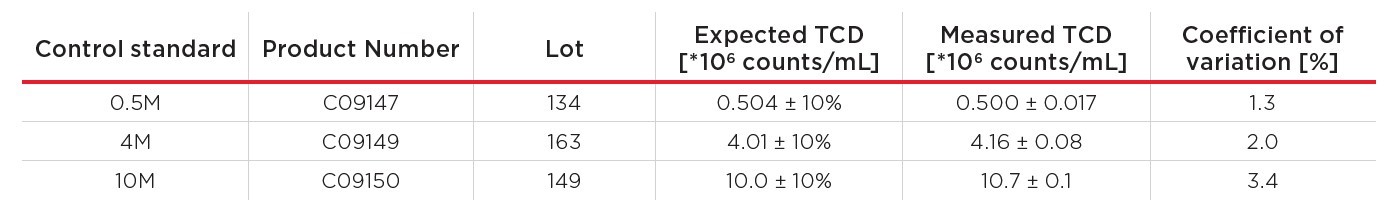
Table 1. Control standards.
Per control, eight single-use vials were measured, and the average measured total cell density (TCD) per standard is shown in Figure 1. The 4M and 10M standard resulted in values slightly above the expected TCD, but all measurements were within the accepted 10% range. The coefficient of variation (CV) of all control standards was well below 5%. A linear regression was performed with excel, resulting in a coefficient of determination (R2) of 0.9999, showing excellent linearity.
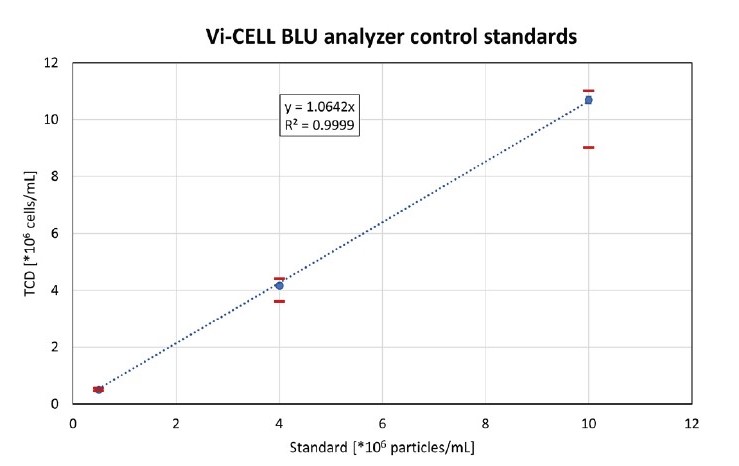
Figure 1. Analysis of 0.5M, 4M and 10M concentration control standards with the Vi-CELL BLU device. The trend line was fitted through
(0;0). The red bars show the acceptable range of the used control standards. The vertical error bars are barely visible due to the low CVs
for all samples.
Preparation of a CHO cell dilution series
Next, a CHO cell dilution series was prepared to verify that the linearity seen with the control standards holds up with live CHO cells across the entire measurement range of the Vi-CELL BLU device. Here, a CHO suspension IgG1 producer cell line from Rentschler Biopharma SE (Rehberger et al., 2013) was used. First, the cells were cultivated at 37°C at 180 rpm (25 mm orbital shaking diameter) in 50 mL PowerCHO medium (Lonza), supplemented with L-glutamine and PenStrep (both Carl Roth GmbH + Co. KG) to a final concentration of 2 mM L-glutamine, 100 I.U./mL penicillin and 100 μg/L streptomycin. The cells were harvested at a TCD of 4.21*106 cells/mL, with a viability of 97.08% and pelleted by centrifugation at 180 rpm for 5 minutes. The pellet was resuspended in 13.3 mL of fresh PowerCHO medium, resulting in a TCD of 18.05*106 cells/mL (average of 10 replicates, measured with the Vi-CELL BLU analyzer). The resulting cell suspension was used to establish a dilution series with nine different cell concentrations, ranging from 0.03*106 to 18.05*106 cells/mL (Table 2).
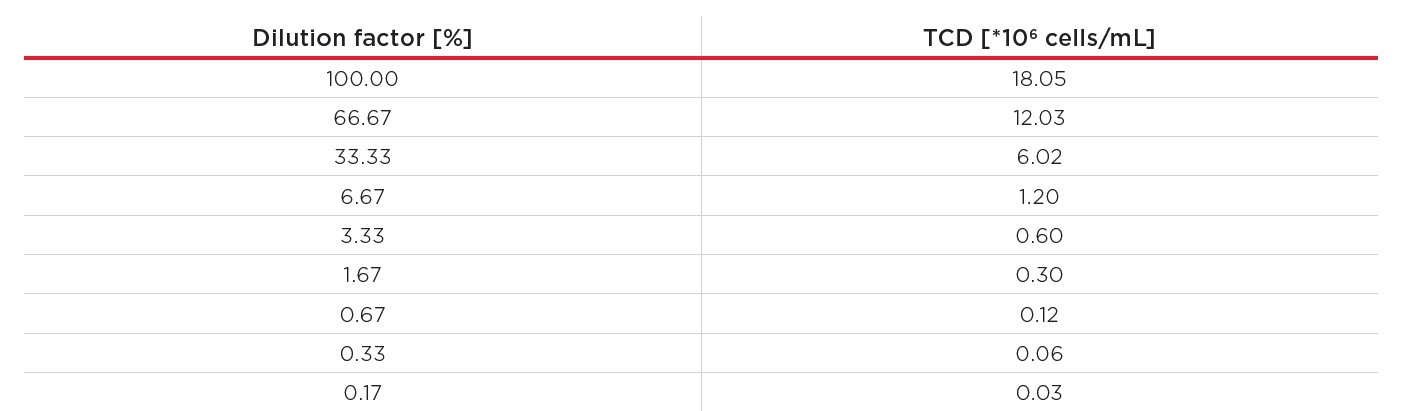
Table 2. CHO dilution series. All concentrations – except 18.05*106 cells/mL – are calculated concentrations from the starting suspension’s TCD and the dilution factor.
Measurement of CHO cells
Then, all cell concentrations were measured with the Vi-CELL BLU Cell Analyzer in Normal Wash mode (200 μL sample), loaded into the 24-sample carousel, with the customized cell type settings described in Table 3. Per concentration, ten replicates were measured.

Table 3. Cell type settings for the measurement of the CHO cell dilution series.
Cell counting analysis
Finally, all data was collected and analyzed. The average measured TCD and the coefficient of variation per dilution are shown in Table 4.
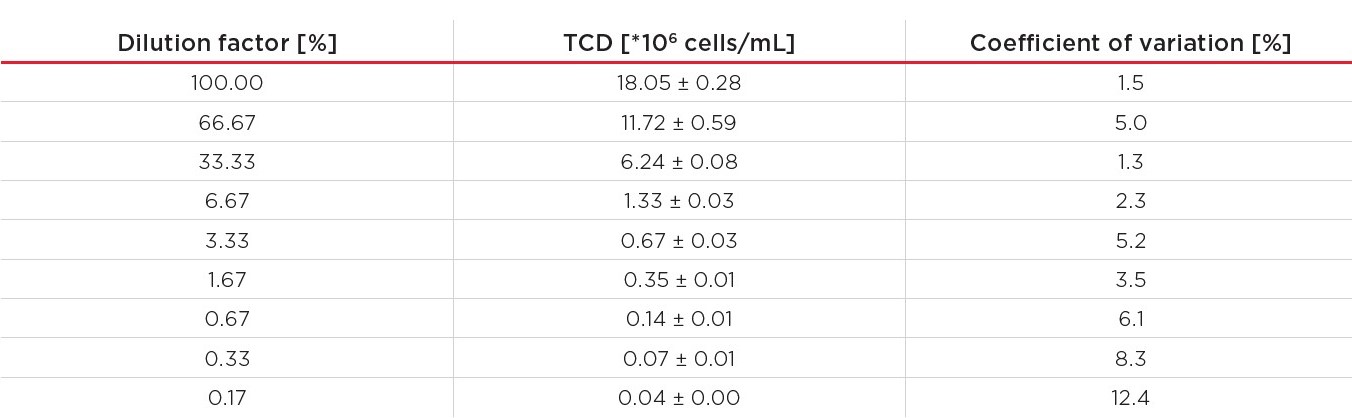
Table 4. Measured average TCD and the coefficient of variation for the dilution series.
A graphical representation of this data can be found in Figure 2. Based on the accuracies of the pipettes, horizontal error bars were calculated, and vertical error bars were added to represent the standard deviation across the replicates.
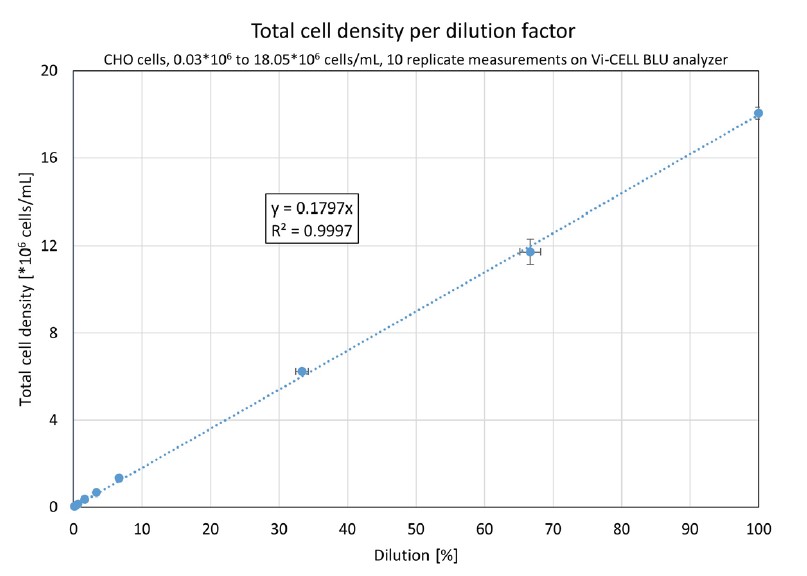
Figure 2. A Vi-CELL BLU analyzer’s results from 0.03*106 to 18.05*106 cells/mL, 10 replicates per dilution. The horizontal error bars represent the uncertainty of the dilution, the vertical error bars show the standard deviation. The linear regression curve was forced through (0;0).
The data in Figure 2 shows excellent (R2 = 0.9997) linearity across the entire range. This confirms that the Vi-CELL BLU analyzer provides an excellent linearity over the complete concentration range between 0.05*106 and 15*106 cells/mL.
Typically, lower cell concentrations are more prone to measurement uncertainties because the overall number of cell counts per image are low. A more in-depth analysis of a device’s performance with low cell concentration is shown in Figure 3. Here, only the lower six datapoints are shown, ranging from 0.03*106 to 1.20*106 cells/mL.
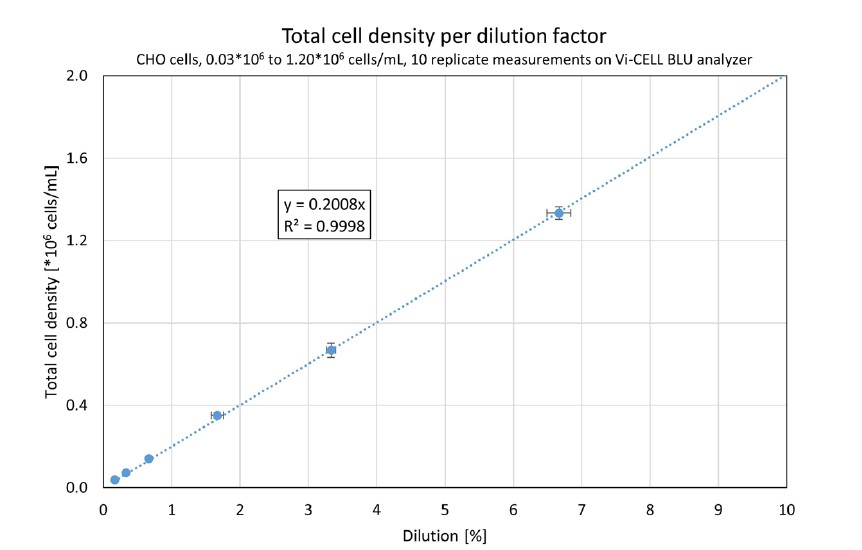
Figure 3. A Vi-CELL BLU analyzer’s results from 0.03*106 to 1.20*106 cells/mL, 10 replicates per dilution. The horizontal error bars represent the uncertainty of the dilution; the vertical error bars show the standard deviation. The linear regression curve was forced through (0;0).
Again, an excellent linearity is seen (R2 = 0.9998), proving that this Vi-CELL BLU analyzer accurately distinguished low cell density samples. Within the Vi-CELL BLU analyzer’s measurement range, the coefficient of variation for all samples was less than 10%, showing the system’s precision – even at low cell densities.
Conclusions
The presented data confirms the ability of the Vi-CELL BLU analyzer to accurately determine the cell concentration across a wide range (Beckman Coulter Life Sciences, 2019). The average total cell counts of a CHO cell dilution series ranging from 0.03*106 to 18.05*106 cells/mL showed excellent linearity (R2 > 0.999), even beyond the lower end of a device’s measurement range. Moreover, all samples within the appropriate measurement range showed a coefficient of variation under 10%, further supporting the capabilities of the Vi-CELL BLU Cell Counter and Analyzer.
References
- Beckman Coulter Life Sciences. (2019). Cell Counting Performance of Vi-CELL BLU Cell Viability Analyzer. (PART-5060APP03.19).
- Rehberger, B., Wodarczyk, C., Reichenbächer, B., Köhler, J., Weber, R., & Müller, D. (2013). Accelerating stable recombinant cell line development by targeted integration. BMC Proceedings, 7(S6), P111. doi:10.1186/1753-6561-7-s6-p111
