Automated 3D Cell Culture and Screening by Imaging and Flow Cytometry
Michael Kowalski, Staff Applications Scientist | Beckman Coulter Life Sciences, Indianapolis, IN
Vipat Raksakulthai, Field Application Scientist 2 | Molecular Devices, Sunnyvale, CA
Kristin Prasauckas, Manager, Field Applications Scientist | Molecular Devices, Sunnyvale, CA
Tara Jones-Roe, Marketing Manager | Beckman Coulter Life Sciences, Indianapolis, IN
Abstract
Three-dimensional (3D) cell cultures offer greater physiological relevance than monolayer cultures for cellular interaction studies and compound screens. However, manual manipulations of these cultures can be laborious and challenges are amplified as sample throughput increases. We used the Biomek FXP Workstation to automate the culture and drug sensitivity screening of cancer spheroids in Perfecta3D® Hanging Drop Plates. Automated steps include the plating of cells and addition of compounds to the hanging drops to induce apoptosis. Staining reagents were also added to analyze the spheroids by high content imaging. Finally, the transfer and dissociation of the spheroids into single cell suspensions was automated to enable flow cytometry analysis. Automated hanging drop cancer spheroids showed excellent consistency across wells and analyzing these spheroids by two complementary methods generated a more complete picture of drug responses in 3D cultures.Introduction
Drug developers are rapidly adopting three-dimensional (3D) cell cultures for drug screening since they can provide a more physiologically relevant environment than two-dimensional cell cultures. Spheroids are a simple and well characterized in vitro tumor model system and are increasingly being recognized as useful organoid models as more cell types are successfully used. These 3D cultures have higher levels of cell-cell interactions when compared to monolayer cultures and the spheroidal structure creates diffusion gradients. These diffusion gradients mimic what would be encountered when treating solid tumors, and therefore provide a more relevant drug response model. In addition, cells on the interior of the sphere may respond differently to compounds if the oxygen or nutrient gradient has driven them into quiescence since many anti-cancer therapies target rapidly dividing cells.
One way of generating 3D spheroid cultures is through the use of hanging drops. This method has long been used in the formation of embryoid bodies as part of the differentiation process for embryonic stem cells1. Many cancer cell types, as they settle in the bottom of a suspended droplet where they will not come in contact with plastic, will spontaneously aggregate into a single spheroid per drop. Aggregation of other cell types may require or be aided by the addition of extracellular matrix components or crowding agents such as polyvinyl alcohol.
96- and 384-well Perfecta3D® Hanging Drop Plates (HDPs) are designed to facilitate the culture of consistent and controllable spheroids and co-cultures in hanging drops. The HDP wells are designed to limit the hanging drop size to ensure consistent spheroid sizes while plate reservoirs above and below the droplets reduce evaporation (Figure 1). The flexible HDP format allows users to create unique model systems, such as by controlling spheroid size by varying the starting cell number or the length of incubation2. In addition, spheroids formed from patterned co-cultures (added simultaneously or sequentially) can be used to study cell-cell interactions or processes such as invasion3. The Perfecta3D® HDPs provide an excellent format for high-throughput applications of 3D cultures; however, plating, maintenance and treatment of these spheroid cultures can be laborious, particularly as sample throughput increases. We will show how automation can assist 3D cell culture laboratories by reducing the time spent on these manipulations while also improving their consistency.
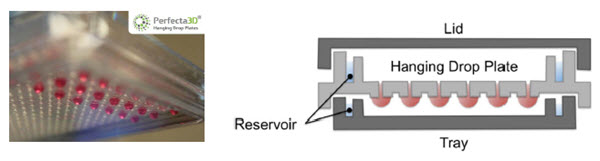
Figure 1. Perfecta3D® Hanging Drop Plate. Droplets hang below the level of the plate to allow cell clustering and spheroid formation while reservoirs reduce evaporation.
Finally, there are a variety of ways to analyze 3D spheroids, each of which may have advantages or disadvantages. High-content imaging can provide information of the spheroid as a whole, such as the location of responding cells; however it is difficult to acquire quantitative data at the cellular level since lower magnification is required to visualize the spheroid and there is not a single plane of focus. Flow cytometry can be used to analyze a spheroid at the cellular level; however this analysis requires the dissociation of spheroids into single-cell suspensions. We have automated the sample preparation for both of these analyses and will show how both analyses may be required to achieve a complete understanding of spheroid drug responses.
Materials and Methods
Cell Culture and Reagents
HCT 116 colorectal carcinoma cells were cultured in McCoy’s 5A Modified Medium with 10% fetal bovine serum. 4000 cells were plated in Perfecta3D® HDPs in 40 μL media containing 0.25% polyvinyl alcohol to accelerate the initial cellular aggregation. Spheroids were treated with serial dilutions of the following compounds and maximal concentrations: 1 μM 5-fluorouracil, 5 μM camptothecin, and 2.5 μM staurosporine. Spheroids were assayed for apoptosis by staining with CellEvent® Caspase-3/7 Green (Life Technologies) and propidium iodide. For fluorescent imaging assays, cell nuclei were stained with NucBlue® Live ReadyProbes® Reagent (Life Technologies).Automation
A Biomek FXP Workstation with a 96-channel head and Span-8 pipettors (Figure 2A) was utilized for all 3D cell culture plating, compound dilution and addition, and sample preparation steps. The 96-channel head utilized enhanced multichannel selective tip pipetting, which allows any pattern of tips to be used (Figure 2B). A HEPA-filtered enclosure provided a sterile environment for cell manipulations and the flexible deck configuration allowed the integration of an incubator and other devices to automate the complete cellular workflow.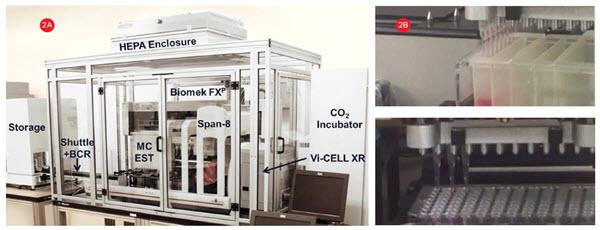
Figure 2. Cell culture system. A) A Biomek FXP Workstation with a 96-channel head and Span-8 pipettors inside a HEPA-filtered enclosure for
automating sterile cell manipulations. 3D cultures were grown in HDPs in an integrated incubator for complete workflow automation. B) The 96-channel head utilized enhanced selective tip pipetting which provides additional flexibility by enabling any pattern of tips to be used.
High-Content Imaging
Spheroid images were acquired with an ImageXpress® Micro high content analysis system (Molecular Devices). For size and circularity analysis, day three spheroids were imaged at 10X magnification using transmitted light. Fluorescent images were acquired on day four spheroids following compound treatment and staining using DAPI, FITC and Cy3 filters at 10X magnification. Pauses were added after well or filter changes to ensure the spheroid was stationary during image acquisition. Z-stacks were acquired to ensure the optimal plane of focus was imaged for each spheroid.Flow Cytometry
Flow cytometry preparation required the transfer and subsequent dissociation of spheroids into single cell suspensions by addition of Accumax® (EMD Millipore) and mechanical disruption through repeated pipetting. Dissociated cells were then stained and analyzed on a Gallios flow cytometer (Beckman Coulter). 2500 events were acquired per sample and fluorescence was detected in the FL1 and FL3 channels. Data were analyzed in Kaluza software (Beckman Coulter).Automated 3D Screening Workflow

Figure 3. 3D Culture Workflow. The formation, treatment, and analysis of cancer spheroids required three steps over a four day process. Each of these steps presented unique challenges that were overcome through automation.
Automation is commonly used to improve experimental repeatability by improving accuracy and precision as well as by reducing user-to-user variability and human error. It also helps free scientists from tedious or complex tasks that require significant time at the bench. Spheroid culture in Perfecta3D® plates held numerous challenges and automation was essential for improving all steps of the screening workflow. These challenges and solutions are described for each step of the workflow in more detail below.
Day 0 – Cell Plating
Cells were added to the HDP in a column-wise fashion using the 96-channel enhanced selective tip (EST) pipetting. By using a single column of tips, we were able to access a smaller reservoir with a dead volume <1 mL rather than the >20 mL excess volume required for a 96-channel reservoir. The plating of the hanging drops required precise tip location and was time consuming to accomplish manually but optimized Biomek labware definitions and pipetting techniques available on the 3D Biomatrix website achieved consistent drop formation. The drops could also be easily lost by tilting or jarring the HDP when moving it from the hood to an incubator. To avoid this, the speed of the automated HDP movement on the Biomek was reduced in a labware-specific manner. This allowed the rest of the actions (loading tips, liquid transfers, etc.) to be carried out at full speed, resulting in the plating of 96 wells in less than 8 minutes.Day 3 – Compound Dilution and Addition
Apoptosis-inducing compounds were added to the first row of a 96-well plate and media containing 1% DMSO was transferred to the remaining rows using the Span-8 pipettors. The compounds were then serially diluted in a row-wise fashion using the 96-channel EST. The final row was left as a negative control row (DMSO alone). We found that the addition of DMSO reduced the surface tension of the hanging drops and therefore some volume of media had to be removed before compound addition.
The 96-channel EST was used to remove 10 μL of media from the top of the hanging drops and add 10 μL of compounds. The ability to finely control the tip position and speed of aspiration prevented the loss of any droplets or spheroids during this step. 96 wells could be treated in less than 7 minutes, although the EST feature also facilitated treating a subset of the columns, allowing for replicate wells or compound addition at different time points.
Day 4 – Sample Preparation
a) High-content imaging: As above, the 96-channel EST head was used to remove 6 μL of media from the top of each drop and add 6 μL of diluted staining reagent. A full plate could be processed in under 8 minutes after which it was returned to the incubator for two hours before imaging. b) Flow cytometry: The Span-8 pipettors added PBS to a 96-well round bottom plate. The 96-channel EST head was used to mix and aspirate the spheroids from the HDP and transfer them to the PBS wells. The HDP wells were then washed with PBS to collect any remaining spheroids. Manual aspiration of the spheroids had a high failure rate and other spheroid harvesting methods were required, but when automated, this transfer was consistently achieved. Following the transfer, the media and PBS in the dissociation plate had to be removed since the presence of residual serum could inhibit the enzymatic dissociation of the spheroid. The ability to control the location of the tips within the wells allowed the 96-channel EST head to slowly remove the PBS and media from the side of the well at the level of the liquid to remove as much volume as possible without aspirating the spheroids. Following the addition of Accumax to the wells, the 96-channel EST repeatedly mixed the wells to physically dissociate the spheroids over 30 minutes. Finally, the Span-8 pipettors were used to add staining reagents and dissociated cells to flow cytometry tubes. The span ability allowed the accessing of multiple tubes at once to accelerate this otherwise slow process. 96 wells could be processed in 48 minutes and cells were stained at 37°C for one hour before analysis.
As with all cell culture manipulations, there is always the potential for introducing contamination. No antibiotics were used in the media and no contamination was detected throughout the four-day process, indicating the HEPA enclosure and sterile tips were sufficient to maintain culture sterility.
3D Culture Analysis
Spheroid Consistency
To utilize spheroids for compound screening, they must be consistent across wells. To assess the consistency of spheroids at the time of treatment, day three spheroids were imaged and analyzed for size (area and perimeter) and circularity (shape factor). Across 47 images (Figure 4A), the spheroids showed consistent size as illustrated by low coefficients of variation (CVs) for both area (5.95%, Figure 4B) and perimeter (2.86%). Spheroids also showed an excellent level of circularity, as illustrated by a shape factor value of 0.85 (1.0 indicates a perfect circle). This property was also consistent across spheroids as demonstrated by a CV of 1.96% suggesting the spheroids were sufficiently consistent for screening.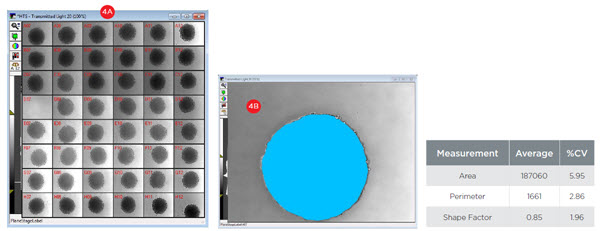
Figure 4. Spheroid Consistency. A) 48 wells of day three spheroids were imaged at 10X magnification with transmitted light. B) Spheroids were analyzed for size (area and perimeter) and circularity (shape factor). Across 47 images, the consistency of spheres is illustrated by coefficients of variation (CVs) below 6%. An average shape factor of 0.85 indicates the spheroids show excellent circularity as a perfect circle has a shape factor of 1.0.
Apoptosis Analysis
Figure 5 show images of spheroids that were treated with 5-fluorouracil, camptothecin, and staurosporine at the indicated dilutions for 24 hours and stained for markers of apoptosis. A fluorescent substrate was utilized to detect activated caspase 3/7 and propidium iodide (PI) was used to detect a loss of cell membrane integrity. A high degree of correlation was seen between the two stains, indicating that apoptosis was occurring in the treated spheroids. Staurosporine treatment showed a traditional dose-response curve with maximal staining at the highest concentration and decreasing stain intensity down the column. In contrast, camptothecin shows a maximal response at the 1:4-1:8 dilution (~1.25 μM), indicating a non-monotonic dose response curve. Finally, 5-fluorouracil shows minimal staining with both reagents and no dose response, suggesting this compound was ineffective at inducing apoptosis in the spheroids.
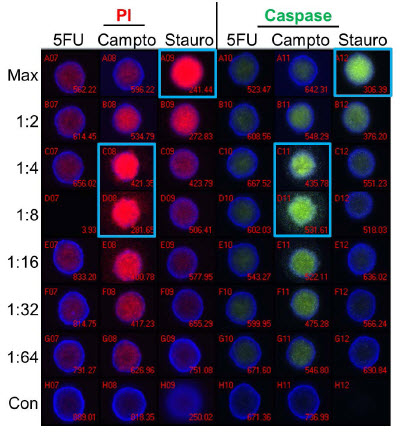
Figure 5. Apoptosis Analysis - Imaging. Spheroids were treated with 5-fluorouracil (5FU), camptothecin (Campto), and staurosporine (Stauro) at the indicated dilutions for 24 hours and stained for apoptosis markers for analysis by imaging. Control spheroids (Con) were treated with DMSO alone. Wells with maximal staining by propidium iodide (PI) or activated caspase substrate are identified by blue boxes. Staurosporine shows a traditional dose response while the highest level of staining was seen at the 1:4-1:8 dilutions of camptothecin. 5-fluorouracil treatment resulted in no significant staining of spheroids.
Figure 6 shows flow cytometry analysis of identically treated spheroids that were dissociated and stained for apoptosis markers. The flow cytometry results show many similarities to the imaging data. A high correlation between propidium iodide and caspase staining is seen and a traditional dose-response curve is seen with staurosporine treatment. The non-monotonic dose-response curve is still seen with camptothecin, with the highest response at a 1:4 dilution. However, a further level of detail is seen with flow cytometry, in that the percentage of cells staining positively with any marker can now be assessed. Both staurosporine and camptothecin treatments give a maximal response of ~70% of cells staining positively. In addition, we see that the percentage of unstained cells (gray) increases at the maximal concentration and 1:2 dilution of camptothecin, indicating that the decrease in signal in the imaged spheroids was due to reduced induction of apoptosis and not to high levels of toxicity and degradation of fluorescent cells.
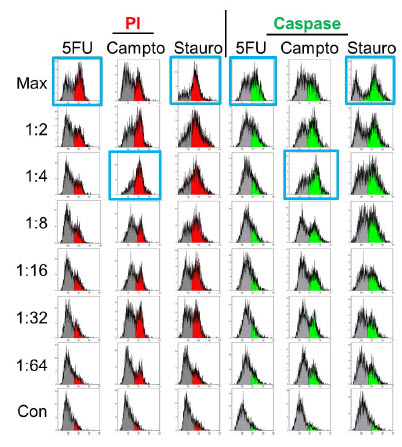
Figure 6. Apoptosis Analysis – Flow Cytometry. Spheroids treated identically as in Figure 5 were dissociated and stained for apoptosis markers and analyzed by flow cytometry. Maximal responses (blue boxes) correlate with imaging results for staurosporine and camptothecin but 5-fluorouracil treatment shows significant positive staining
(>50% at maximal concentration).
Interestingly, a significant contrast with the imaging data is seen in the 5-fluorouracil-treated samples. By flow cytometry we see a significant percentage (>50%) of cells treated with the maximal 5-fluorouracil dose staining positive for apoptosis markers. There is also an apparent dose response, as positive staining decreases as the concentration of 5-fluorouracil decreases and this suggests the staining is a real phenomenon and not an artifact from spheroid dissociation. This indicates that apoptosis was induced in the spheroids by 5-fluorouracil but staining reagents were unable to diffuse into the spheroid, resulting in a false negative. This suggests that the cytotoxic effects of camptothecin and staurosporine are greater than 5-fluorouracil and may be sufficient to disrupt the spheroidal structure sufficiently that the diffusion gradient is lost.
Discussion
Here we have shown the automation of 3D cell culture in Perfecta3D® plates using the Biomek FXP Workstation. This automated workflow includes all the necessary steps – from cell plating, to spheroid treatment, to preparation for analysis by imaging and flow cytometry. Enhanced selective tip pipetting provided numerous advantages over traditional 96-channel heads, including reducing reagent dead volume and the ability to access selected wells of a 96-well plate. The optimized pipetting techniques showed dramatic improvements over manual cell plating and spheroid transfer. The number of lost hanging drops or spheroids left behind during sample preparation for flow cytometry were greatly reduced with automation (data not shown). Automated cell plating also resulted in consistent spheroid formation and serial dilutions of compounds gave dose-response information for 3D cultures. In addition, the efforts required for steps such as the repeated pipetting of 96 wells to generate single cell suspensions would have been overwhelming to perform manually.
To perform a fully-automated screen using Perfecta3D® plates, additional instruments can be integrated to the Biomek FXP. The sterile enclosure and integrated incubator allowed the automation of all culture and sample preparation steps, and the higher throughput required by a screen would be facilitated by integrated tip and plate storage. In addition, these multi-day applications can be scheduled and interleaved with one another with scheduling software that tracks instrument usage and availability (Figure 7). The software also retains information across time and processes through the use of barcoded plates and this data can be accessed remotely in real time and be used to drive process decisions. Finally, the data shown here was generated on a stand-alone imager and flow cytometer. We have successfully integrated the ImageXpress® Micro (Figure 8) and numerous other analyzers, including plate-based flow cytometers, which could be used for complete automation of spheroid screens.
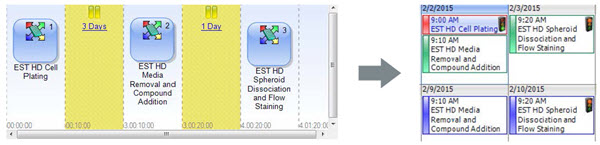
Figure 7. Automated HDP Compound Screen. The software for an automated screening system can link together the steps of the four day workflow and interleave experiments on a calendar to show instrument availability.
The results shown here also emphasize how the two different analyses provided complementary data. Imaging data can be acquired at multiple time points during the spheroid formation or treatment stages. This can be essential in cases like 5-fluorouracil treatment, which may have shown positive staining with longer drug or staining reagent incubations. It can also provide information on where within the sphere certain processes are occurring. Apoptosis inducing compounds may only affect dividing cells and the inner cells of more mature spheroids could show drug resistance due to entering quiescence. This would be indicated by staining occurring predominantly on the outer portion of the sphere. However, as we saw, the lack of interior staining could also mean that a staining reagent has been unable to diffuse into the spheroid in the allotted time. Flow cytometry removes this potential for false-negatives while also providing data at the cellular level. Flow cytometry can distinguish whethera more brightly-stained sphere is due to an increase in the number of cells staining positively or an increase in the intensity of the positive cells.By combining these two forms of analysis, a more complete picture of spheroid responses can be obtained.
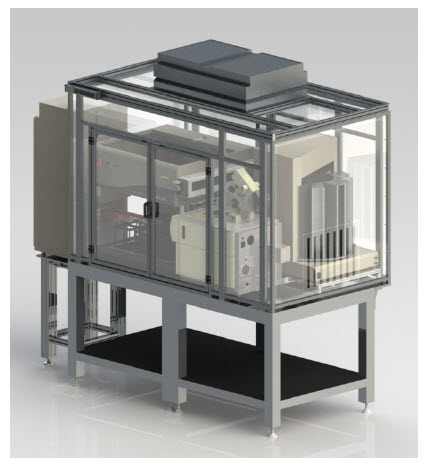
Figure 8. Automated HDP Compound Screen. A rendering of a potential HDP screening system that utilizes imaging as the primary assay. Plating, treatment, and staining could be completed using a Biomek NXP Workstation with a 96-channel EST head while analysis is performed on an integrated ImageXpress Micro.
While Perfecta3D® HDPs are just one method for studying 3D cultures, we have shown how they may be used to screen cancer spheroids for susceptibility to apoptosis inducers. The challenging manipulation of the hanging drops quickly makes automating this process a necessity from both a reliability and time savings standpoint. Automation of the full 3D cell culture process provided the consistent spheroids that are required for screening while automating the sample processing for both imaging and analysis removes the barrier to gathering the complementary data required to gain a complete understanding of spheroid drug responses.
References
1. Doetschman TC, Eistetter H, Katz M, Schmidt W, Kemler R. The In Vitro Development of Blastocyst-Derived Embryonic Stem Cell Lines: Formation of Visceral Yolk Sac, Blood Islands and Myocardium. J. Embryol. Exp. Morphol. 1985, 87, 27–45.
2. Tung YC, Hsiao AY, Allen SG, Torisawa YS, Ho M, Takayama S. High-throughput 3D spheroid culture and drug testing using 384 hanging drop array. Analyst. 2011, 136(3), 473-478.
3. Hsiao AY, Tung YC, Qu X, Patel LR, Pienta KJ, Takayama S. 384 hanging drop arrays give excellent Z-factors and allow versatile formation of co-culture spheroids. Biotechnol. Bioeng. 2012, 109(5):1293-304.
